
 The gold/silver ratio measures how many ounces of silver are needed to equal the value of one ounce of gold. Tracked since ancient times, this simple calculation, dividing the current price of gold by the price of silver, offers insight into the relative strength of these two major precious metals. For instance, if gold is priced at $1,800 per ounce and silver at $20, the ratio would be 90.
A high gold/silver ratio may indicate that gold is relatively overvalued or that silver is undervalued, while a low ratio suggests the opposite. These shifts are often driven by investor sentiment, gold tends to gain favor during times of crisis or inflation, whereas silver typically benefits from industrial demand during economic growth. While the ratio can signal potential investment opportunities, determining its “fair” level is challenging, as it reflects a complex mix of factors including mining costs, monetary policy, and global market dynamics.
Historical Perspective
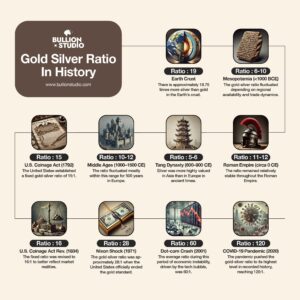
The natural ratio of gold to silver in the Earth’s crust is approximately 1 to 18.75, meaning silver is about 18.75 times more abundant than gold. This baseline has influenced, but not dictated, how the two metals have been valued throughout history.
In practice, historical gold/silver ratios have varied significantly due to cultural, economic, and geopolitical factors. In Mesopotamia, the ratio was around 8, likely reflecting local availability and metallurgical knowledge. During the Roman Empire, the ratio stabilized around 11, a level that persisted through much of the Middle Ages, driven by both metals being used extensively for coinage, trade, and religious purposes.
Interestingly, in Asia, silver often held a higher relative value than in the West. For example, in ancient China, the gold/silver ratio was as low as 5, reflecting different monetary systems and demand dynamics. This regional difference highlights how local economic and cultural contexts shaped metal valuations.
With the onset of industrialization, the ratio began to fluctuate more significantly. In the 18th century, massive silver discoveries in the Americas boosted supply, pushing the ratio closer to 15. By the late 19th century, shifts in monetary policy, especially the demonetization of silver, and industrial demand led to increasing volatility in the ratio.
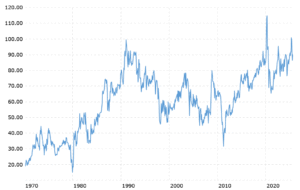
In modern times, economic crises have caused dramatic spikes. For instance, during the COVID-19 pandemic, the ratio soared to around 120, underscoring silver’s greater price sensitivity and gold’s role as a safe-haven asset.
Recent Ratio and Outlook
As of August 2025, the gold/silver ratio is approximately 90, which places it on the higher end of the historical range since the Nixon Shock and the end of the gold standard in the early 1970s. Future movements in the ratio will likely be influenced by factors such as inflation expectations, economic growth, central bank purchasing trends, and the outlook for interest rates. Over the long term, some analysts predict the ratio could rise even further if gold continues to be favored as a safe-haven asset. Others believe silver may stage a comeback, reversing its long-term underperformance thanks to increasing industrial demand and its role in green technologies such as solar energy and electric vehicles.
While the gold/silver ratio is a useful tool, it has its limitations. Strategies based on this ratio typically require a long-term investment horizon, sometimes spanning decades, an approach that may feel too slow in today’s fast-paced, tech-driven world. Investors must be patient and have a solid understanding of market dynamics to fully benefit from changes in the ratio.
Despite these challenges, the gold/silver ratio remains a valuable indicator. Its long historical record, conceptual simplicity, and ability to reflect shifting economic forces make it an essential metric for anyone navigating the precious metals market.